Now that I've added a blog to the site I decided to post monthly analysis updates showing the latest fundraising progress by various criteria.
All of 2023:
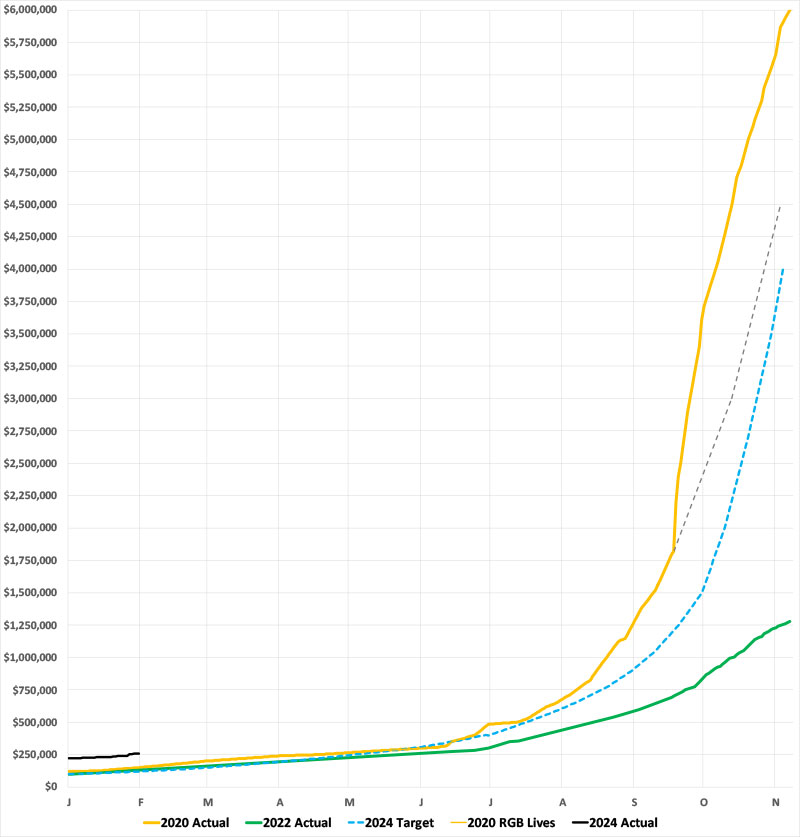
For the 2023 -2024 cycle, I ended 2023 having raised just over $220,000. Around half of this went to (successfully) help Virginia legislative candidates in their 2023 election; they ended up keeping control of the state Senate and flipping the state House, giving them control over both chambers of the state legislature.
Another $15,000 went to help statewide candidates in three red states which had elections last fall: Kentucky, Louisiana and Mississippi. We successfully held onto the Kentucky governorship, Lost every other statewide race which is unsurprising given the red lean of all three. A further $12,000 went to help New Jersey Democrats keep their solid majority in the garden state. The remaining $81,000 raised last year went to form a base for this year's Main event races.
For comparison, I had only raised $120,000 in all of 2019, and had only projected raising $100,000 by the end of 2023 for this cycle...so I started the year 84% ahead of the same point 4 years ago or 120% ahead of where I was expecting to be at that point this cycle, depending on your POV.
That bring us up to today:
January 2024:
- Raised: $39,580 (Jan. 2020: ~$30,000; +32%)
- 1/31/24 Raised: $258,573 (Jan. 2020: ~$150,000; +72%)
- 1/31/24 Projected: $120,000 (116% ahead)

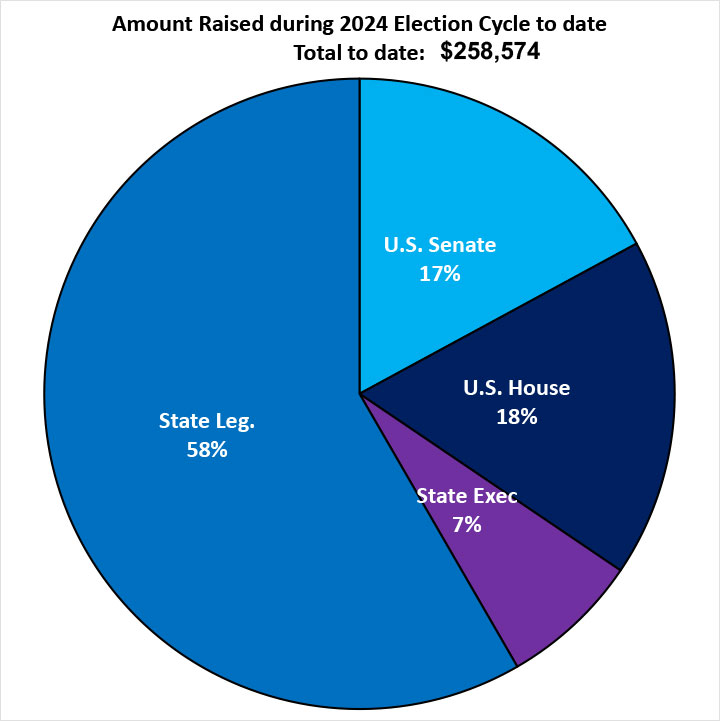
Next, here's where things stand regarding types of races donations are going to. As noted above, the fundraising so far is still heavily skewed by the 2023 state legislative races in Virginia and New Jersey: Over 58% of the $259K total has gone to state House/ Senate races (which also includes state Democratic parties as well as the legislative Democratic caucus/campaign committees, especially until after the filing deadlines & primaries pass in each state).
Another 35% has gone towards federal races--interestingly, this is split almost evenly between the U.S. House and U.S. Senate pages.
Finally, just 7.2% has gone towards Statewide Executive races, which makes sense given that there is very few competitive gubernatorial, attorney general or secretary of state races this year, and hardly any of those have presumptive nominees yet anyway.
I was originally envisioning each of the four categories--State legislative, US House, US Senate and Statewide Executive--receiving roughly 25% of total donations through my pages. However it's starting to look as though this cycle will be split more like perhaps ~40% State Legislative, 25% US House, 25% US Senate and 10% Statewide Exec...and that's not necessarily a bad thing, given how much Democrats need to play catch-up in state legislative races.
It will be interesting to see how these proportions shift between now and November. For comparison, in the 2020 cycle, over 80% of the $6 million that I raised for Democrats went to US Senate races, with only a small portion going towards State Legislative races.

Finally, let's look at my ongoing Social Media Platform Engagement experiment.
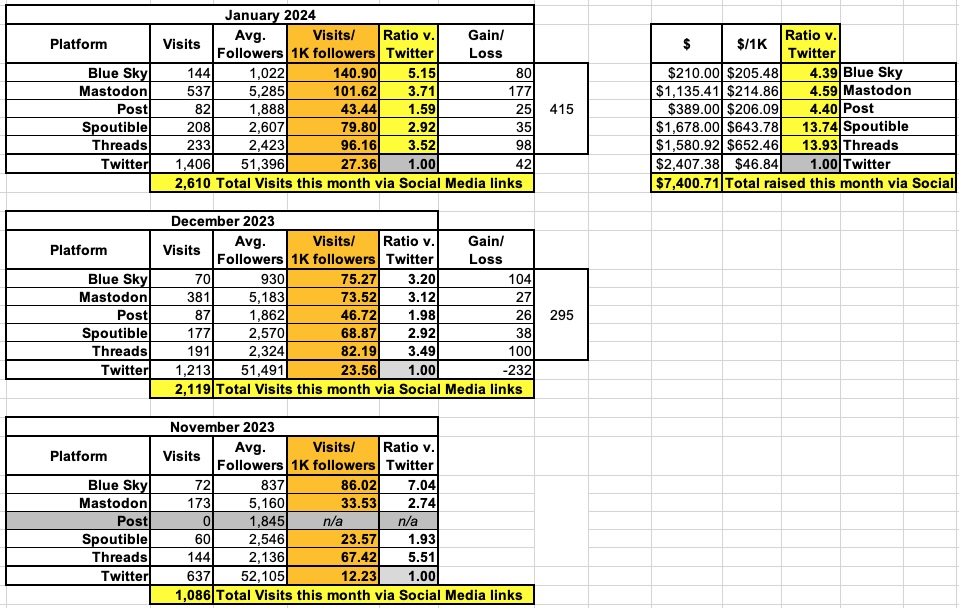
Back in November 2023, I started including referral codes with the ActBlue fundraising links I posted across various social media platforms. this allowed me to start tracking how many people were clicking the links I posted via Twitter, Threads, Mastodon and so on.
I also started tracking how many followers I had on each platform, since those increase or decrease over time, so I could start tracking clickthrus per follower, which is necessary for an apples to apples comparison; obviously getting more visitors through Twitter doesn't mean much if I have ~50 times as many followers on that platform than on another one.
The tables below show how each platform compared in November, December, and January (I didn't add Post until December).
As you can see, while the ratios vary each month, the pattern is clear: Every one of the other platforms is showing greater active engagement than Twitter on a per follower basis:
- BlueSky: 7.0x higher, 3.2x higher & 5.2x higher
- Mastodon: 2.7x, 3.1x & 3.7x
- Post: n/a, 2.0x & 1.6x
- Spoutible: 1.9x, 2.9x & 2.9x
- Threads: 5.5x, 3.5x & 3.5x
December was also the month when I started tracking how many followers I gained or lost that month; this has nothing to do with the fundraising project mind you; that's just an interesting bit of side data for me. In November I lost over 1,000 Twitter followers, most of which I'm pretty sure had to do with my refusal to bow down to antisemitism. In December I lost another 232 via Twitter, but gained nearly 300 across the other 5 platforms (admittedly, some of these likely overlap). Interestingly, however, in January, not only did I gain over 400 new followers on the other platforms, I actuslly gained 42 followers on Twitter as well. Huh.
Finally, starting in January, I also began tracking the actual dollar amounts donated via people who clicked thru using those referral code links on each platform. I debated whether to do this, because it seems a little unfair given that a single $10,000 donation can completely swamp several hundred other small donations on other platforms, but I figured it would at least be worth keeping an eye on to see if any patterns emerge.
With that in mind, for January at least he pattern is similar: Every other platform is kicking Twitter's butt on a per-follower basis, with folks on Spoutible and Threads donating nearly 14x as much apiece than on Twitter, while BlueSky, Mastodon and even Post users all donated more than 4x as much on a per follower basis than Twitter users.
(It's important to note that the $7,400 total only includes donations via people who donated via those referral code links in January; the other $32,000 raised in January came through either the Blue24.org site or people just clicking the plain ActBlue links directly.)
