Four years ago, at the end of February 2020, I had raised a total of just over $200,000 for Democrats up & down the ballot, broken out as follows;
- U.S. Senate Seats: $118,340 (59.0%)
- U.S. House Seats: $59,575 (29.7%)
- State Execs (Gov/AG/SoS): $942 (0.5%)
- State Legislative Seats: $20,466 (10.2%)
- Biden/other POTUS: $1,367 (0.7%)
- Other: n/a (0.0%)
-
TOTAL: $200,690
So how am I doing this year by comparison?
- U.S. Senate Seats: $52,544 (18.4%)
- U.S. House Seats: $50,691 (17.8%)
- State Execs (Gov/AG/SoS): $14,683 (5.1%)
- State Legislative Seats: $153,775 (53.9%)
- President Biden: $2,791 (1.0%)
- Voters of Tomorrow/Other: $10,680 (3.7%)
-
TOTAL: $285,164
So far I've raised 42% more than at the same point four years ago...but the breakout is dramatically different.
Here's what the breakout looks like side by side:
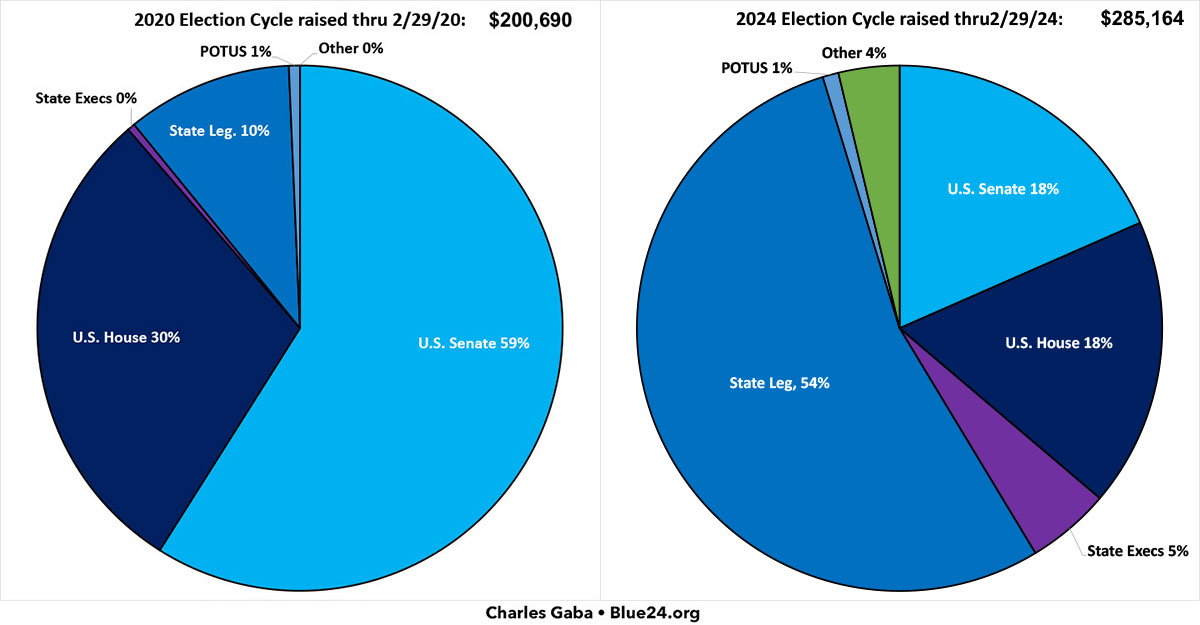
As you can see, while 2020 was all about retaking the U.S. Senate, this time around I'm putting a much greater emphasis on STATE LEGISLATURES, which also includes state Democratic Parties. I've also been including Voters of Tomorrow Action on most of my fundraising pages this cycle ("Other") although I'm phasing that out as each state's filing deadline and/or primary passes & more actual Democratic nominees are locked in.
Here's what it looks like another way:
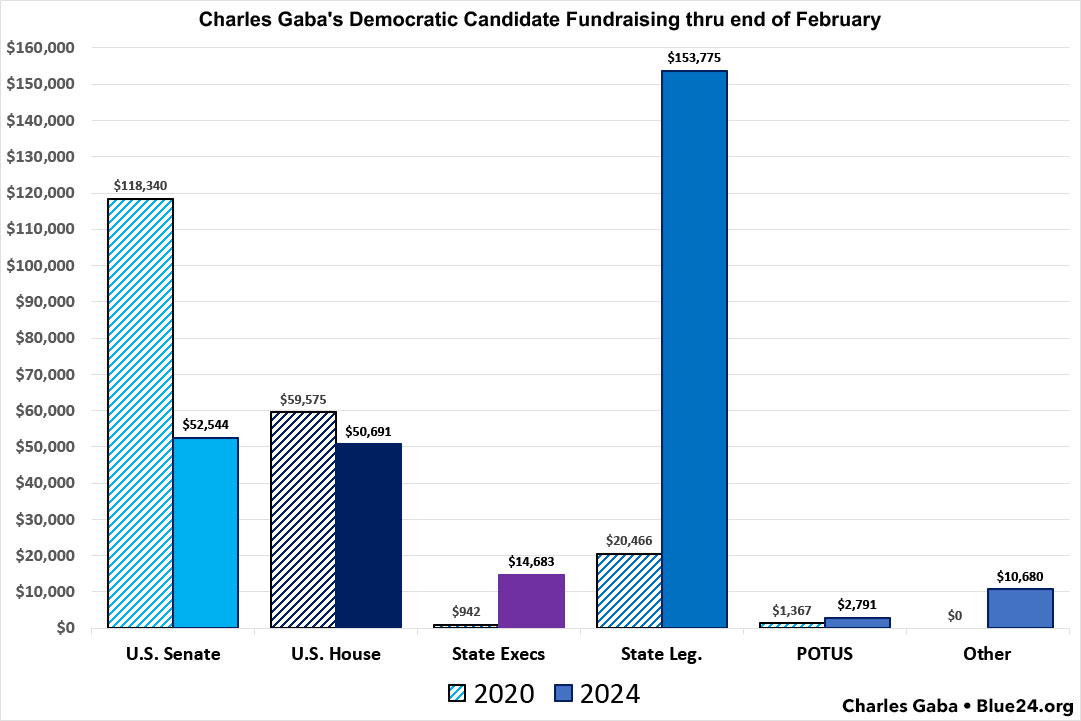
The most dramatic difference is the huge increase in state legislative race donations--over 7.5x as much so far vs the same point last cycle! Similarly, state executive race fundraising (Governor, Attorney General, Secretary of State) is way up as well (15x as much, although that's compared against almost nothing in 2020).
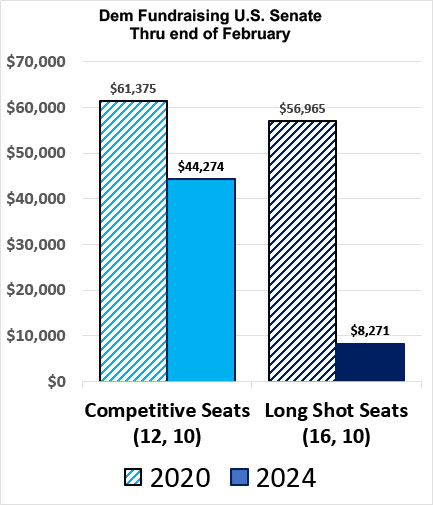
On the flip side, the dramatic drop in Senate fundraising is somewhat concerning, but even there it's not as bad as it looks...because a much greater portion of the donations so far have been going to the competitive Senate races as opposed to the long shot races.
In 2020, there were a dozen Senate races which were generally considered up for grabs: AZ, CO, GA (x2), IA, ME, MI, MN, MO, NH, NM & NC. There were another 16 Republican-held seats which were basically unflippable by Dems, but which I listed on the fundraising page in order to encourage party building/etc.
This year there's only 10 Senate seats I consider competitive (or at least potentially competitive): AZ, FL, MI, MT, NV, NJ, OH, PA, TX & WI. There's another ten GOP seats which are likely pipe dreams but again, you never know.
As of February 2020, Senate donations were split nearly evenly between the two (52% / 48%). As of today this cycle, however, over 84% of the Senate funds I've raised have gone to one of those ten competitive races, with just 16% going to the other ten long shots combined. As a result, while my total Senate fundraising is down 56%, for competitive seats it's only down 28%. Still not ideal, of course, but much better.
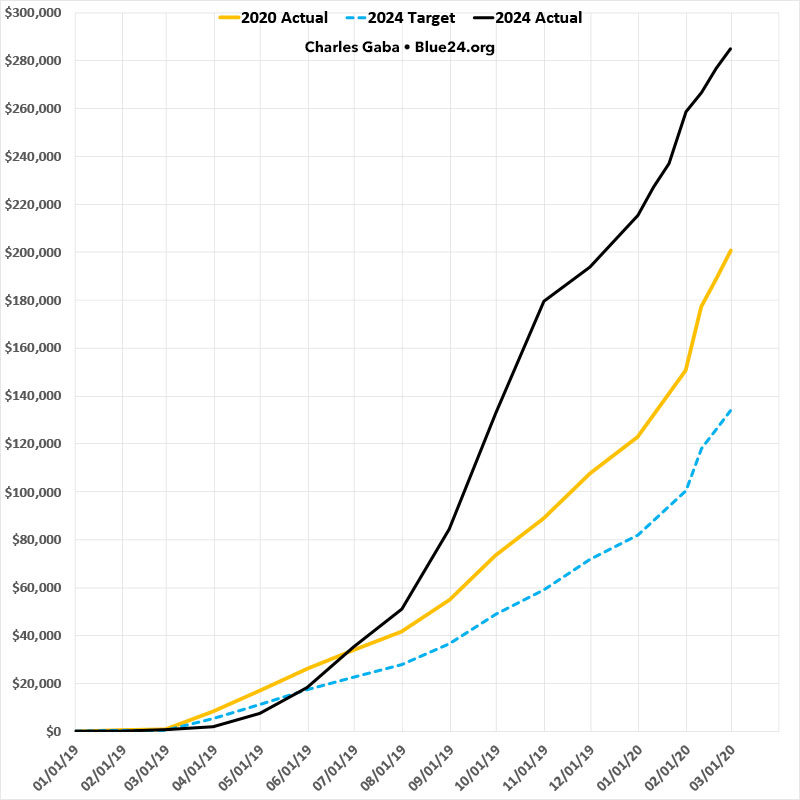
Here's what the fundraising project has looked like over time for both cycles. The orange line is how much I actually raised (total) during the 2020 cycle. The dotted blue line is how much I expected to raise this cycle--I was erring on the side of caution, assuming that I'd probably only raise perhaps 2/3 as much this time around given the unique circumstances surrounding the 2020 election.
Instead, so far at least, I've been proven wildly wrong (much to my pleasant surprise!)...so far I've raise 42% more than the same point four years ago!
Obviously this may not last (in fact, there was a significant slowdown in February vs. January), but only time will tell. In the meantime, I'm currently on track to break $300,000 sometime around mid-March.
Finally, let's look at my ongoing Social Media Platform Engagement experiment.
Back in November 2023, I started including referral codes with the ActBlue fundraising links I posted across various social media platforms. this allowed me to start tracking how many people were clicking the links I posted via Twitter, Threads, Mastodon and so on.
I also started tracking how many followers I had on each platform, since those increase or decrease over time, so I could start tracking clickthrus per follower, which is necessary for an apples to apples comparison; obviously getting more visitors through Twitter doesn't mean much if I have ~50 times as many followers on that platform than on another one.
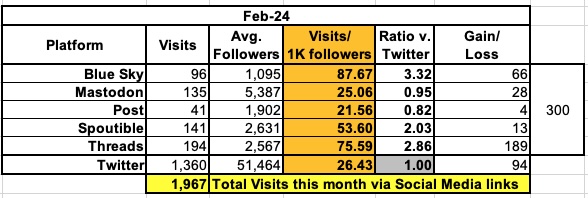
The table below show how each platform compared in February.
Until last month, every one of the other five platforms dramatically outperformed Twitter on a per follower basis, with most of them seeing 2 - 6x as many clickthrus per follower than Twitter did.
In February, however, there was an interesting change on two of them: Post, which has always been the 2nd-worst performing platform, came in 18% behind Twitter...and Mastodon, which had previously been among the best-performing platforms, ran nearly even with Twitter. And I think I know why.
Each of the other platforms automatically recognizes & generates the "preview card" image (the thumbnail graphic which links to the ActBlue page), but these don't seem to work properly on Mastodon for whatever reason; it just generates a plain text link. Starting February 1st I began manually uploading/attaching the preview image, figuring it would help boost clicks if people could see the candidates I was asking them to donate to. However, unlike preview cards, these are just plain images which don't actually link to anything...and I think attaching them may have been a mistake, because Mastodon's clickthru rate dropped dramatically, from ovder 100/follower in January to just 25/follower in February.
So...starting tomorrow I'm going to go back to not attaching the preview image in Mastodon to see if that helps. It speeds things up not having to attach them anyway, but we'll see.
One other noteworthy item: Not only have I stopped losing followers on Twitter after last fall's post-October 7th antisemite diaspora, but I actually gained followers for the second month in a row (+42 in January, +94 in February). Across all 6 platforms I gained 300 new followers total.
(Note: I've decided not to track the amount of donations by social media platform after all; it's too much work and it can be too easily skewed by a single generous donor throwing the curve off).
